Our Services
From spreadsheet to webpage, we offer a full suite of services that will bring your data to life online.

Visualization
Ensure site visitors get the most out of your data with visually appealing and easy-to-understand charts, maps, and interactives.
Websites
Provide users with the best possible experience for the task at hand via a website tailored to your data.
Strategy Audits
Prioritize improvements to your visualizations and site based on a thorough review by our content strategists and data design experts.
Management
Take control of your data. Automate dataset processing, handle data updates on your own, switch between chart types, and configure chart displays from your website’s CMS.
Style Guides
Establish site-wide visualization styles that reflect your brand and can be referenced by developers, designers, and site editors.
User Testing
Gain greater insights into the needs of your users. We can perform user testing for visualizations, interactives, and data-focused websites.
Preparation
Streamline your data publishing process. We can provide guidance on a data format that will seamlessly drive your visualizations or microsite and optionally perform the processing for you.
APIs
Drive your data visualizations and data-focused websites with a performant data API.
Our Approach
Successful data visualization and data-focused websites require more than just making a chart or laying out a website. We work iteratively with you to:
1. Identify objectives. We work together to establish what users will accomplish with your data displays. What do you need to communicate? What knowledge or takeaways do you want users to gain? What jobs do your users need to accomplish using your interactives and tools?
2. Get to know your data. You help us to gain a domain understanding of your data so we can effectively design solutions that will meet your users’ needs.
3. Create a concept. Your feedback will help us iterate on sketches and wireframes that outline the functionality of your visualization or website.
4. Design. We’ll apply best-in-class design to provide your users with an elegant experience.
5. Build. Our developers get to work bringing your project to life online.
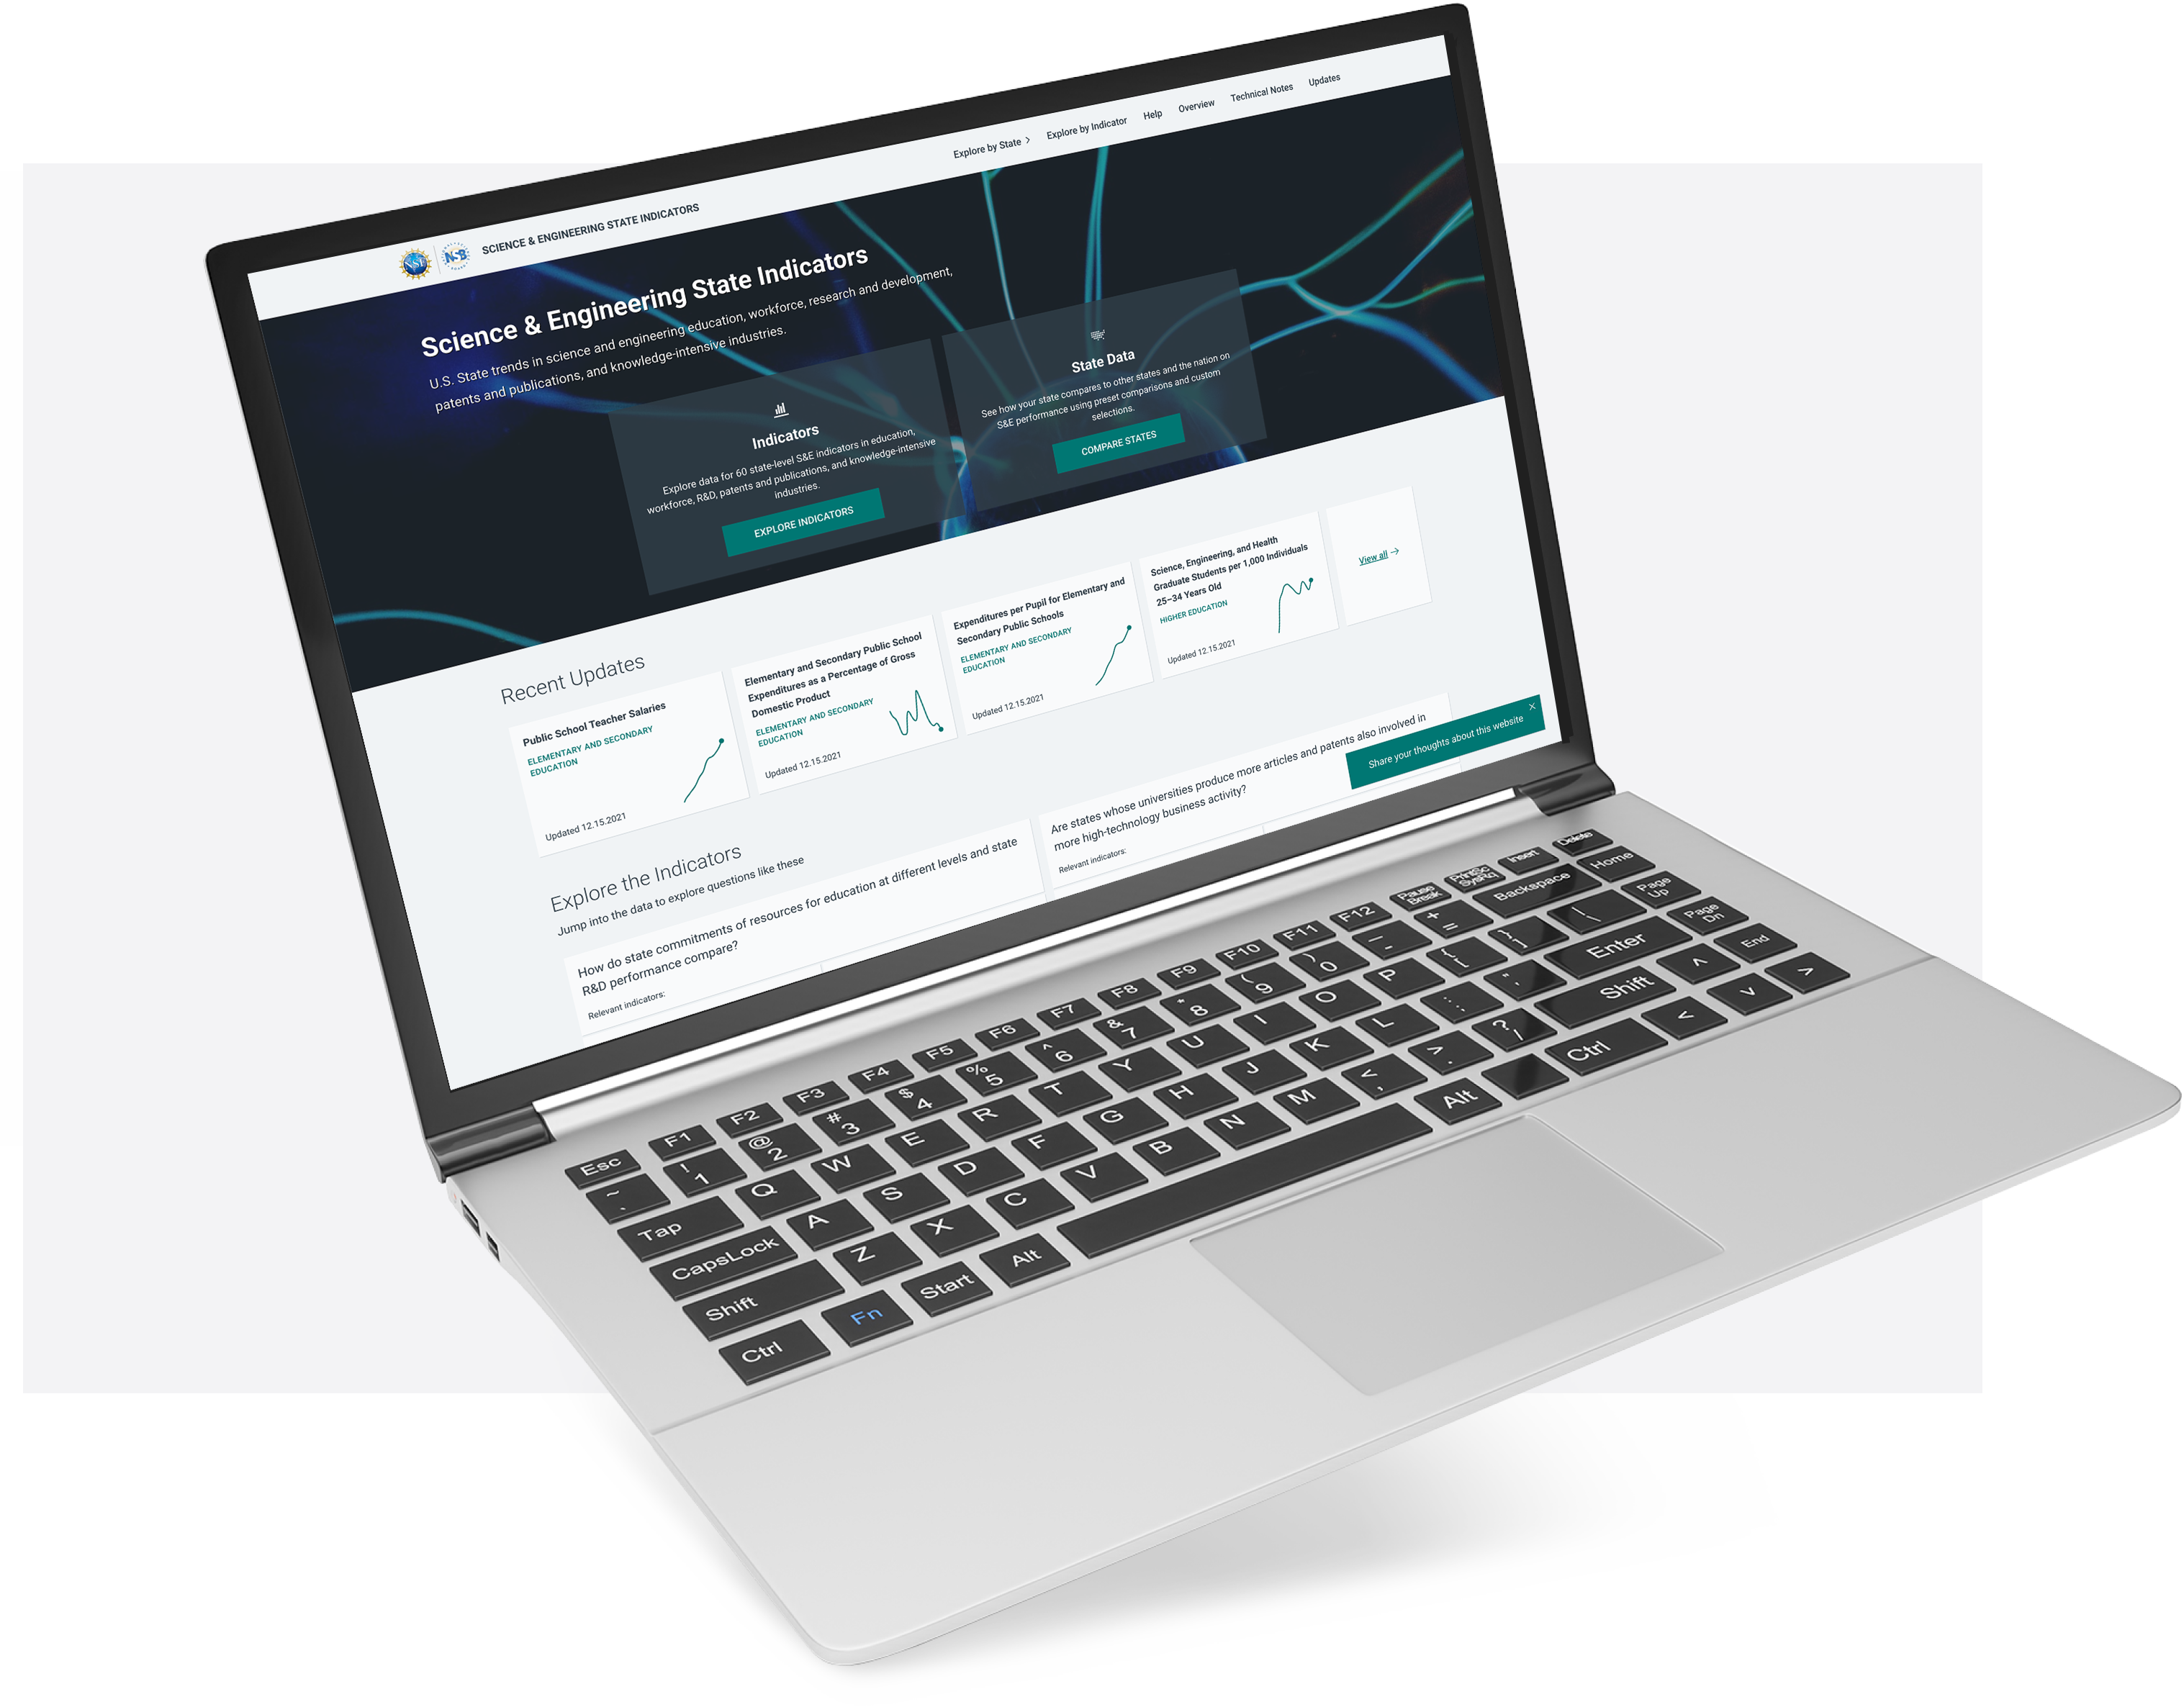
Case Study: Science & Engineering State Indicators
DATA-FOCUSED WEBSITE
Our redesign of the State Science & Engineering Indicators website started with an audit of their previous site design, including the visualizations, and user testing. We then moved on to a full design for everything from navigation to page styles and visualizations. The resulting website allows for easy data updates and customized visualization tools that allow users to get the most out of the data.
Our Data Clients
Our journalism, non-profit and foundation clients all come to us for help communicating data to their users.